
What are the uses for cross-functional flowcharts?
We know that software development teams use flowcharts to diagram steps and decisions. Flowcharts show a process, step-by-step. Flowcharts help teams organize and visualize systems. We can use them to document, brainstorm, or record a decision making process. Most importantly, flowcharts must be easy to read and understand.
Read on How to use Flowcharts for decision-making.
Sometimes teams need a flowchart to show more than just the process. They might need to show who is responsible for a decision or action. They might need to show a timeline or project stages. In these cases, software development teams create a super-charged flowchart. These flowcharts we call cross-functional flowcharts.
Cross-functional flowcharts show steps and decisions in a process, as a regular flowchart. They differ in that they show extra information in a grid or in columns or rows.
Make your own diagram with Gleek.
So how do you make a cross-functional flowchart?
Define the lanes of the flowchart. Decide on what roles or stages of the process the flowchart will map out.
Decide what will trigger the cross-functional flowchart. Will it be a support call or a customer ordering an item? A request for reimbursement?
Define all the steps needed in the process, including decisions.
Refine and change the flowchart as needed. Cross-functional flowcharts prove useful as a dynamic document that reflects real-world implementation. Cross-functional flowcharts should relate to other charts and documents.
Cross-functional flowcharts help different teams understand the work and responsibilities of other teams. Cross-functional flowcharts help a marketing department understand the human resources department. Cross-functional flowcharts help the customer service department understand the finance department. Cross-functional flowcharts help large and small organizations understand complex processes.
But cross-functional flowcharts prove useful for smaller groups as well. For instance, a cross-functional flowchart showing the workings of a pizza delivery service. We can define lanes for who must complete each step:
The receptionist takes the order
One chef makes the pizza dough
Another chef put the toppings on the pizza
The baker bakes the pizza in the oven
The delivery driver takes the pizza to the customer
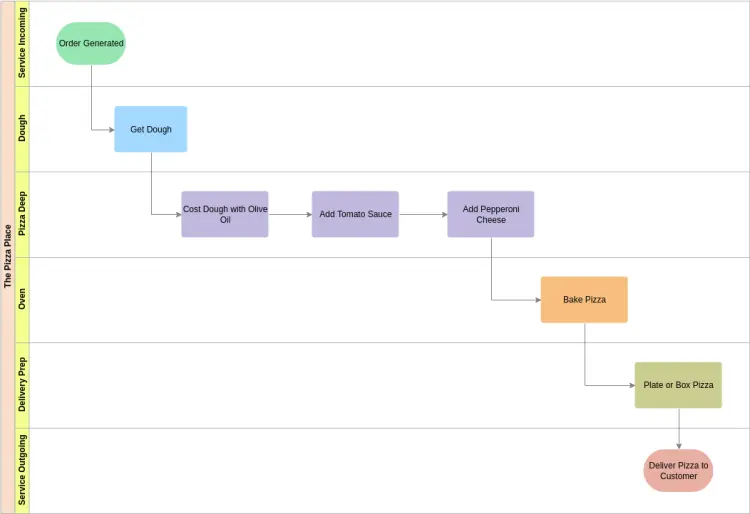
Source: Visual Paradigm – Pizza Place Cross Functional Flowchart
We map out our steps, showing who has the responsibility for each step in the pizza process. Each team member knows their role and responsibility.
Make your own flowchart with Gleek.
Cross-functional flowcharts are sometimes known as swimlane flowcharts. Swimlane charts show who holds responsibility for a step or decision. Some charts use a grid and headings on the x and y axes to give further information. The headings represent a stakeholder or team member responsible for a step in a process. Or the headings show stages in the process. We call these the lanes of the cross-functional flowchart. These swim lanes help avoid confusion of who does what. Cross-functional flowcharts help teams to manage the resources and responsibilities of large-scale projects.
How can we use a cross-functional flowchart to visualize systems?
Say we have a company that needs to streamline its reimbursement process. In large firms, the process will likely involve different people in several departments. First, the people needing the reimbursement will file a form and documentation. Then that person’s supervisor will need to sign off on the reimbursement. After that, the process moves to the finance department. An accountant will approve the reimbursement. Next, the finance office will approve the payment. After that, the process will move to a general manager. The general manager will sign off on the reimbursement. Then they will forward it to a cashier who will issue the payment. In text this takes a while to describe. Presented in a cross-functional flowchart, the process is fast and easy to understand.
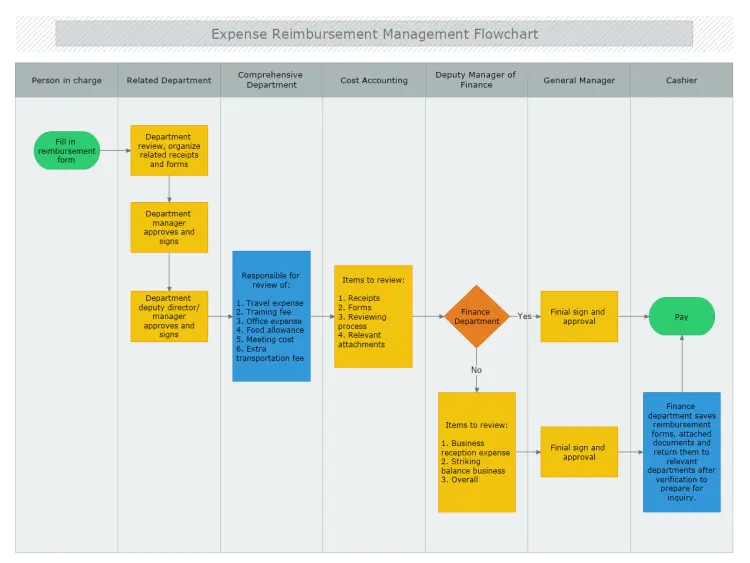
source: My Draw – Expense Reimbursement Management Flowchart
Human resources departments also use cross-functional flowcharts. They can use them to map out the steps of hiring a new employee. First, the department that needs a new hire will alert the human resources department. They will inform them of their requirements. Then the HR department will begin a search for a suitable candidate. After that, an HR employee will screen applicants. After, they will forward suitable candidates to the manager of the department in need. The candidate will interview with their direct supervisor. After that, they will meet with the other team members. Finally, the candidate will meet with an HR supervisor. In a cross-functional flowchart, we can illustrate this process. Each step and decision comes into clear focus. Each stakeholder knows their role and responsibility.
Cross-functional flowcharts prove useful in software development as well. Let’s map out how the process of bug reporting and fixing. First, a customer reports a problem to a customer service representative. Next, the customer service representative creates a trouble ticket. They forward it to the technical support department. A tester in the technical support department will attempt to replicate the error. Next, technical support will attempt to fix the problem. If they cannot fix it, they will forward the ticket to the development department. After they fix the bug, they will alert the customer service representative. Then the representative will inform the customer of the fix. All these steps and decisions we map out in the cross-functional flowchart. Each department and player see their roles and responsibilities. Using a cross-functional flowchart saves time and improves the customer experience.
Make your own flowchart with Gleek.
We can create cross-functional flowcharts in many different software platforms. These include google documents, Microsoft Word, and miro. These drag-and-drop interfaces allow teams to map out complex projects. For simple flowcharts where teams don’t need to use swimlanes, gleek.io works fastest and best. Gleek.io’s simple syntax and intuitive interface work without having to touch a mouse. It is the fastest diagramming and flowcharting application. Gleek gives software developers a quick way to diagram with as few keystrokes as possible.
Related posts
Visual problem solving with flowcharts and mind maps
20 editable flowchart templates & examples
How to Use Flowcharts for Problem Solving
Flowcharts for Decision-Making: Visualizing Options and Risks
What are flowchart symbols? Here’s a handy guide with examples
A step-by-step guide to creating a flowchart in Google Docs
7 stages of the product development process (flowchart example)