
Entity-relationship diagrams, also called ERDs or ER diagrams, are flowchart-like diagrams that explain the structure of entities, attributes, and their relationships in a database. They are mainly used for relational database design, and can be used to troubleshooting designs. There are many notations and symbols that are unique to ERDs that you need to know in order to read and create them.
ER diagram notations and symbols
Similar to other diagram shapes, in ER diagrams entities are represented with rectangles, attributes are represented by ovals or inside entities, and relationships are shown in diamonds or with lines. There are six notation types, some more common than others.
Make your own ER diagram in Gleek.
Arrow notation
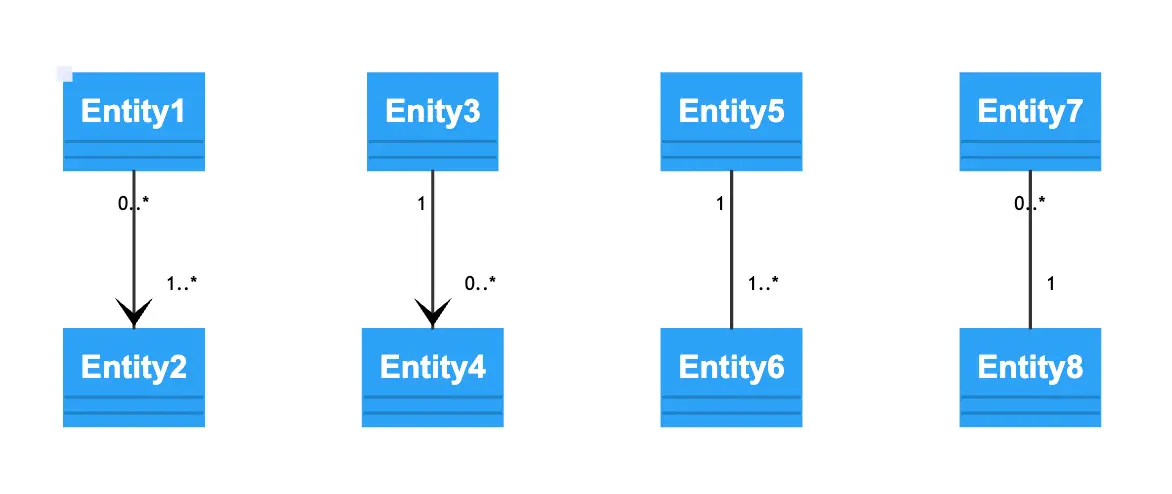
Arrow notation is simple and easily recognizable. Its main focus is the number of relationships entities have within a system.
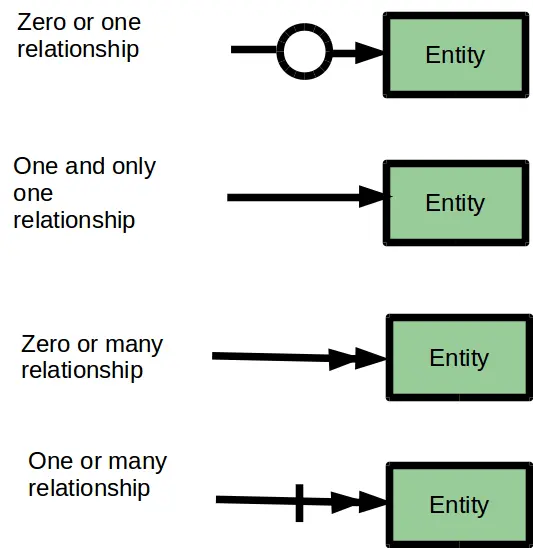
Arrow notation symbols
Zero or one relationship – a single-headed arrow, with an open circle on the line.
One relationship – A straight line with one arrowhead
Zero or many relationships – Two arrowheads, one sitting just behind the other, and a straight line
One or many relationships – Two arrowheads, like above, with a short, perpendicular line.
Barker’s notation
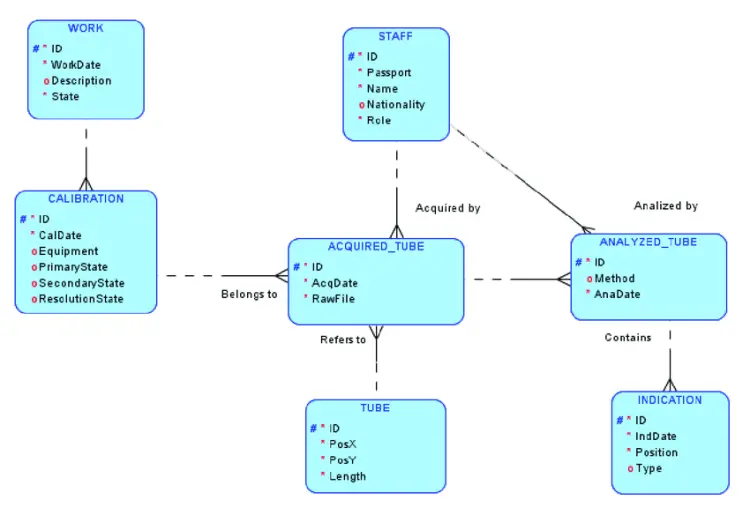
Invented by Richard Barker, this notation is most commonly used for describing data in Oracle. Barker’s notations are widely used, and most people familiar with diagrams have seen these notations before.
Barker’s notation symbols
Entities are displayed as rectangles with rounded edges, attributes with one of three symbols inside the entity box, and relationships with various lines.
Attributes can be shown in one of three ways:
Unique identifier – Shown with a pound sign, or hashtag (#)
Mandatory – This attribute is shown with an asterisk (*)
Optional – Represented by ‘O’
Relationships are drawn to show both optionality and degree, so there each relationship line tells the reader two things.
Optionality symbols
Mandatory relationship – A straight, solid line
Optional relationship – A dashed line
Relationship degree symbols
One to one – One solid line, like with mandatory relationships
One to many – On one end of the line, there are two branching lines, like a fork or a trident
Many to many – Trident shapes are on both ends of the line
UID bar – A perpendicular line, just behind the trident shape on a relationship line
Chen notation
Peter Chen, the creator of Chen’s notation, invented this more detailed way of notation in 1976. Chen’s notation was one of the first to be used in software design, and is still popular in ERD creation. Unlike Barker’s notation and UML, entities, relationships, and attributes have many different ways of being represented.
Chen notation symbols
Let’s start with entities. An entity is shown in a rectangle, just like in many other notations. But, that is where the similarities stop. There are 2 more ways to describe entities:
Weak entity – A rectangle within a rectangle
Associative entity – A diamond within a rectangle
Attributes are in ovals. Here are some other symbols used to define attributes:
Key attribute – The title of the attribute is underlined
Partial key attribute – The attribute’s name is underlined with a dashed line
Composite attributes – These attributes branch off from a larger attribute, and are a different color
Multivalued attribute – An oval within an oval
Derived attribute – An oval with a dashed line
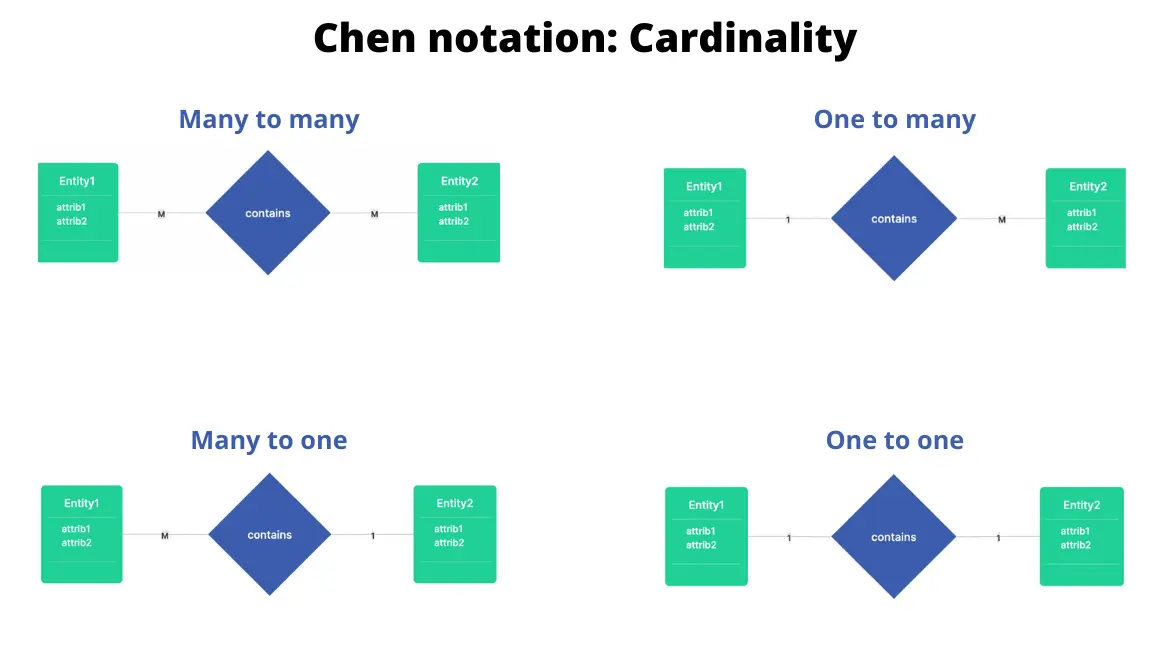
Relationships are defined with optionality, cardinality, degree, participation, and type; using lines and diamonds.
Type
Strong relationship – A solid-lined diamond
Weak relationship – A diamond within a diamond, like a weak entity
Optionality
Mandatory – A solid line
Optional – A dashed line
Note that these are the same as in Barker’s notation.
One to one – A 1 is at each end of the relationship
One to many – A 1 is at one end, and N is at the other. N represents ‘many’.
Many to one – Like one to many, but reversed
Many to many – M is on one end, and N is on the other
Participation
Total participation – Two parallel lines
Partial participation – One line
Crow notation
Crow’s foot notation, often called just Crow notation, uses many of the same symbols as Barker’s notation and arrow notation, but in different ways. Entities are in rectangles with their attributes inside. Relationships are defined much like they are in other notations, but major difference is the presence of multiplicities. Multiplicities are symbols that tell the reader the number of times instances can associate with others.
Make your own ER diagram in Gleek.
Crow notation symbols
Multiplicity symbols
There are two marks that indicate multiplicity. The first mark, closest to the end of the line, represents the maximum number of times an instance of an entity can be associated with other instances
One time – A short, perpendicular line
Many – A three-pronged line, like in Barker’s notation
The second mark, behind the first, represents the minimum number of times an instance of an entity can be associated with other instances. The minimum can only be zero or one, and they are referred to as ‘optional’ or ‘mandatory’, respectively.
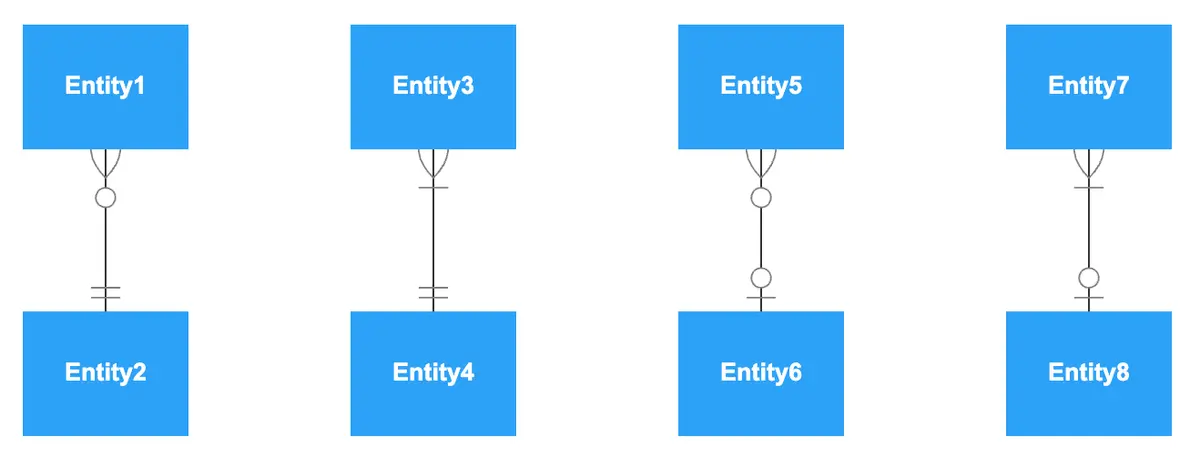
Some of the crow’s foot notation relationships are one-to-many, one-to-one, and many-to-many.
Optional – An open circle
Mandatory – A short, perpendicular line
Check out our step-by-step articles on How to create an ER diagram using crow’s foot notation for a Hospital management system and Online shopping system.
IDEF1X notation
Short for Integration Definition for Information Modeling, this notation style is simple and uses letters more often than the other notations listed here.

IDEF1X notation symbols
Attributes don’t have any specific symbols, but their placement determines what type they are. Primary attributes are listed in the top half of the entity rectangle, and other attributes are listed in the lower half.
Like in Chen notation, entities can be described as weak or strong, or, dependant and independent.
Strong entity – A rectangle with sharp corners
Weak entity – A rectangle with rounded corners
Relationships are shown with either dashed or solid lines, with filled-in circles at one or both ends, like many other notation types. Letters are at the end of relationships lines, and tell the reader the cardinalities of the entity relationships.
Zero, one, or more – No letter
One or more – P
Zero or more – Z
Cardinality is specified – {n}
N to M – N-M
Exactly N – N
UML notation
UML, which stands for Unified Modeling Language, is extremely popular and used in many different diagram types. Check out our recent post on UML diagrams to learn more about them.
Make your own ER diagram in Gleek.
UML notation symbols
Entity – Rectangle shape
Generalization – Empty arrow at the end of a relationship line
Aggregation – Empty diamond at the end of a relationship line
Composition – Filled in diamond at the end of a relationship line
Relationships only have solid lines, and have numbers signifying cardinalities at the end of the line. There are a few ways to show cardinality.
UML notation
Zero or one – 0..1
Only one – 1
Zero or more – 0..*
One or more – 1..*
Specific range – n..m
You might be also interested in: UML vs. ER diagrams: A detailed comparison
Looking to create your own diagram? Try out Gleek, a text-based diagramming tool that allows your to quickly make diagrams with ease. Need to use Chen or Crow’s foot notations? Gleek supports both notation styles. Get started for free today.
Related posts:
ER diagram example: online shopping system (Crow’s Foot notation)
What is the entity-relationship diagram in database design?
How to represent a weak entity in ER diagram
ER diagram for an E-commerce website with Gleek's AI chat
Crow’s foot notation in entity-relationship diagrams
UML vs. ER diagrams: A detailed comparison
Crow’s Foot vs. Chen notation: detailed comparison for 2022
How do you convert an ER diagram into a relational schema?
Enhanced entity-relationship diagram: features and components
11 Best ER diagram tools to use in 2022
ER diagram for a hospital management system (Crow’s Foot notation)
All about ER model cardinality with examples
Relational schema vs. ER diagrams: A detailed comparison
Composite and other attributes in the entity-relationship model