
Before you create a new database, you have to work out what elements you’ll include and how they relate to each other. That’s where the entity-relationship diagram (ERD) comes in.
An ERD is ideal for rapidly sketching out a database at the conceptual level. If you plan the overall scope of what you need, you’ll waste less time when you get to actually building the database.
Make your own ER diagram in Gleek.
What are the components of an ERD?
There are three building blocks used in an ERD: entities, relationships and attributes. The ERD has a pre-defined set of symbols that you use when piecing together the diagram. That makes it easy to use ERDs for any database design, regardless of subject or content.
Entities
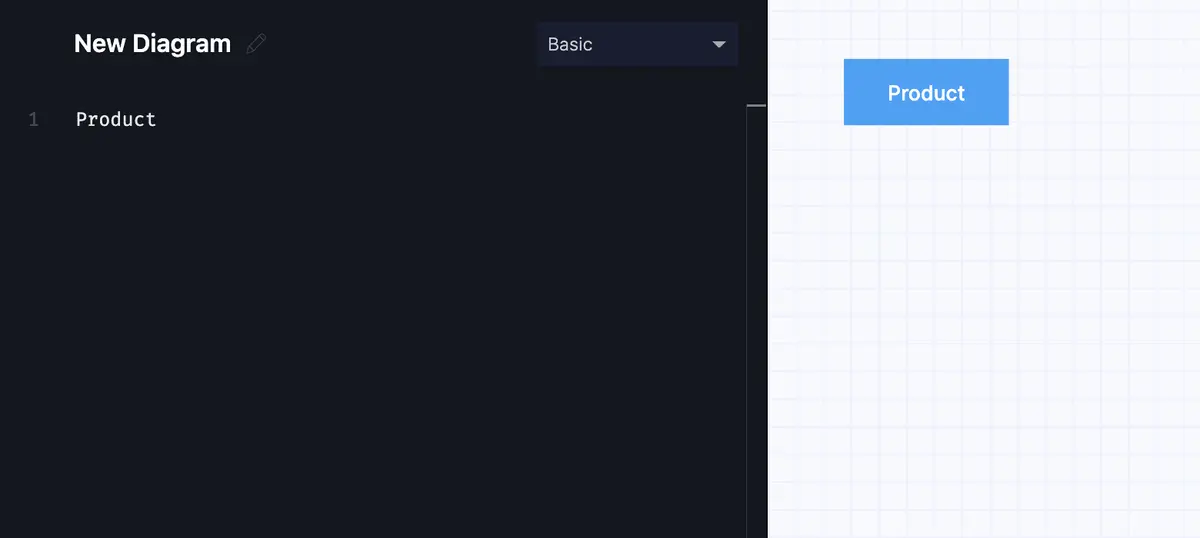
Entities are the real-world elements in your system. You could call them the nouns of your database. Entities in an ER diagram are categorized into two types: strong entities and weak entities. An ERD shows entities as a rectangle:
For instance, if you’re designing a database for an online store, the entities are the product that make up the inventory. Other core entities in your store database will be users and orders.
Relationships
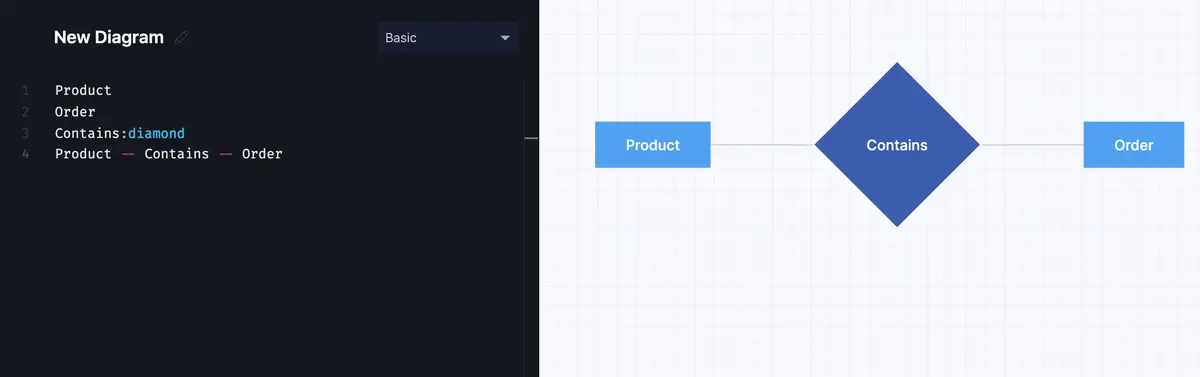
Relationships are the verbs of your ERD and describe how entities are associated with each other. An ERD shows relationships as a labelled diamond on the lines connecting entities:
An online store database has one type of relationship between product and order, and a slightly different relationship between user and order.
Attributes
Attributes are properties or characteristics of entities. You can think of them as adjectives describing the entities in your database. An ERD shows attributes as ovals connected to the relevant entity:
The entities in your online store database will have lots of attributes. To list just a few:
products – name, price and description
users – name, password, address and email address
orders – number of items, date, total amount
There are a number of different types of attributes, including simple attributes that can’t be broken down any further, composite attributes that can contain several simple attributes and even derived attributes, which are worked out from other attributes.

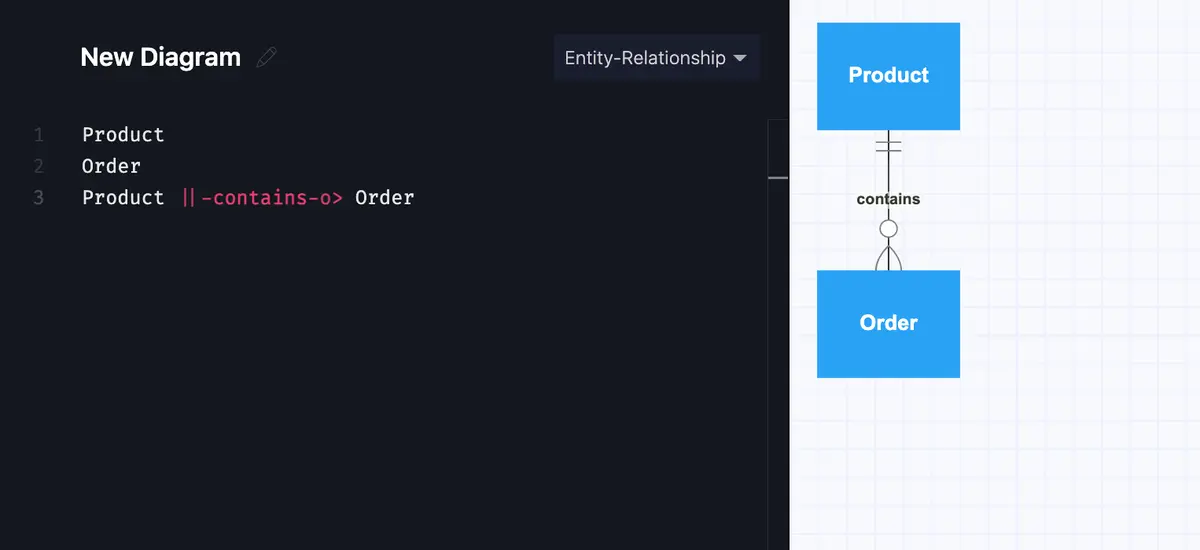
In some cases, you’ll need the relationships in your database to show cardinality. In the actual database, this refers to the numerical relationship between rows of one table and the rows of another. Cardinality allows relationships to get quite complex while still keeping the database manageable.
An example of one-to-one cardinality in our online store is customer ID, where we map each user to a specific number in the database. Each user can have only one customer ID and vice versa.
An example of one-to-many is users to orders. Each user will (hopefully!) make lots of orders, but each order can only be associated with a single user.
We can find an example of many-to-one when we break down an address from a composite attribute into simpler attributes, such as street, city, and zip code. Many users will live in the same city – maybe even the same street.
Many-to-many is illustrated by products and orders. Each product can be added to many orders and each order can consist of many products.
Related post: How to show multiplicity in an ER diagram?
What role does an ERD play in the design of a database?
An ERD has three possible levels of abstraction: conceptual, logical and physical. You can imagine the process as moving from the conceptual, to the logical, and finally to the physical as you design a database. The initial ERD is essential for determining the requirements for a particular project. At this conceptual stage, the ERD gives you a good overview of the entities and relationships in the database. That makes it very useful for discussion and collaboration.
You move on to the logical stage once you need to flesh out the details and define attributes or clarify relationships.
Once you’re ready to build your database, you need to work within the limitations and conventions of a real database system. At this point, you’re dealing with column types, character lengths, and a bunch of other considerations.
Even once you’ve built the database and it’s in use, you can use an ERD for troubleshooting. Drawing out the structure of the database and analyzing the relationships between entities can reveal problems.
Check out how to create an ER diagram for an E-commerce website with Gleek AI chat.
You can also use an ERD when reverse engineering an existing database. By identifying the entities and relationships, you can recreate the structure of the database. If you’re working with a database created a long time ago and you don’t have any documentation, reverse engineering it to create an ER model will provide you with the database schema. The more you know about how the database was originally designed, the easier and safer it is to make changes.
How can you create an ERD?
If you want to try making an ERD, first work out what you need it for. Are you explaining something to a colleague or trying to get the database structure clear in your own mind? It might make a difference to how much detail you need. If you aren’t sure of the scope of the model, you’ll waste time on irrelevant entities or relationships.
Start the design process by identifying the entities involved. Then move on to the relationships between these entities. Next, drill down into the details and add attributes to your entities. Depending on the purpose of the ERD, you can keep going and adding information about the cardinality of relationships, exploding composite attributes or working out entity sets.
As with any design process, you will need to analyze your design for problems or errors and go gradually refine it. Your entity-relationship diagram will serve you well as you progress toward the physical design of the database.
Make your own ER diagram in Gleek.
Ready to make your own ERD? Use Gleek to put together a quick ERD using just the keyboard. No messing around with drag and drop or graphics programs. Gleek is ideal for the conceptual and logical stages of database design. When you want to explain something in a meeting or sketch out a quick idea, just fire up Gleek and type away!
Related posts
ER diagram for an E-commerce website with Gleek's AI chat
Guide to entity-relationship diagram notations & symbols
ER diagram example: online shopping system (Crow’s Foot notation)
Composite and other attributes in the entity-relationship model
Crow’s foot notation in entity-relationship diagrams
How to represent a weak entity in ER diagram
Crow’s Foot vs. Chen notation: detailed comparison for 2022
Surrogate Keys: How are they represented in ER diagrams?
Enhanced entity-relationship diagram: features and components
Relational schema vs. ER diagrams: A detailed comparison
ER diagram for a hospital management system (Crow’s Foot notation)
What is data modeling? Types & process
Quick guide to physical data modeling
Crow’s Foot vs. Chen notation: detailed comparison for 2022