
When you start working on a new project, you need to know what external entities will be involved and how they will interact with your system. A system context diagram will help you to work out these relationships without getting too involved in the details of how your system works.
A data flow diagram (DFD) is a way to show the flow of data through a process or system and the context diagram is a type of DFD. It’s also known as DFD Level 0 because it gives you a quick overview of the system or process being modeled. It’s a high-level design tool meant to define the scope of a project, including its inputs and outputs.
A context diagram leaves out a lot of detail. It focuses on the exchange of data between the system and external entities. The system could be a product, website, platform, or institution. The external entities could comprise a similar list. The flow of data could be anything, from uploaded videos to advertising revenue.
Make your own context diagram with Gleek.
What elements are there in a context diagram?
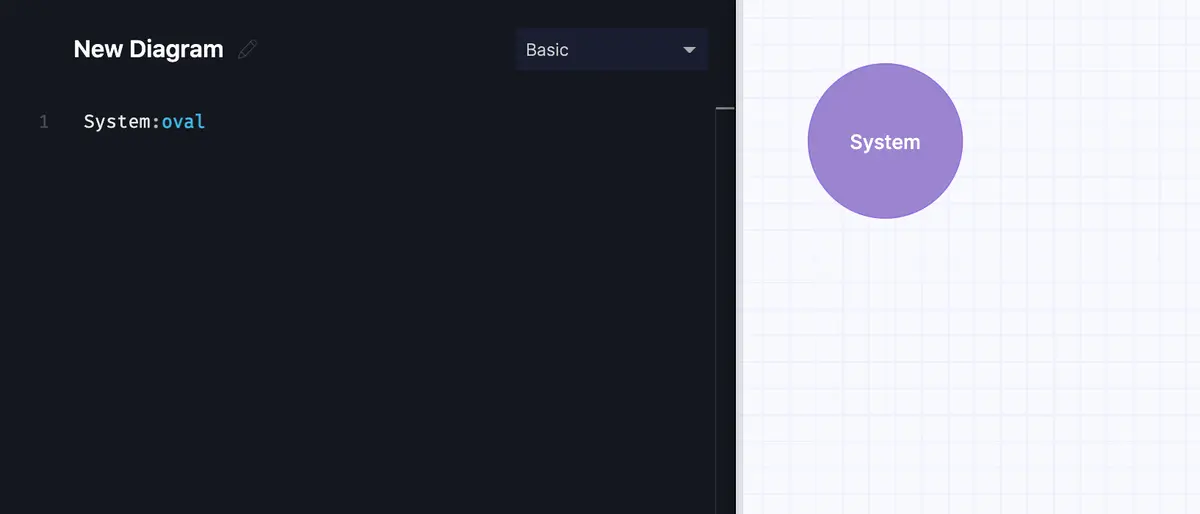
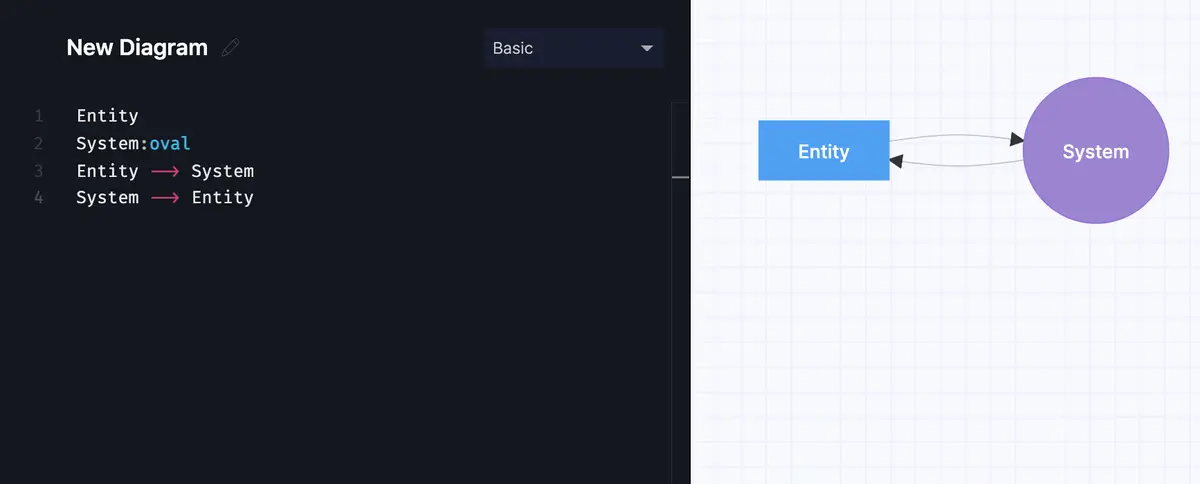
The core element of a context diagram is a circle, or bubble, representing your system. This basic shape sits at the center of the diagram and doesn’t show the internal workings of the process. You’ll be creating your context diagram at the early stages of design, so you can consider the system to be a “black box”. You don’t need to think about what’s inside.
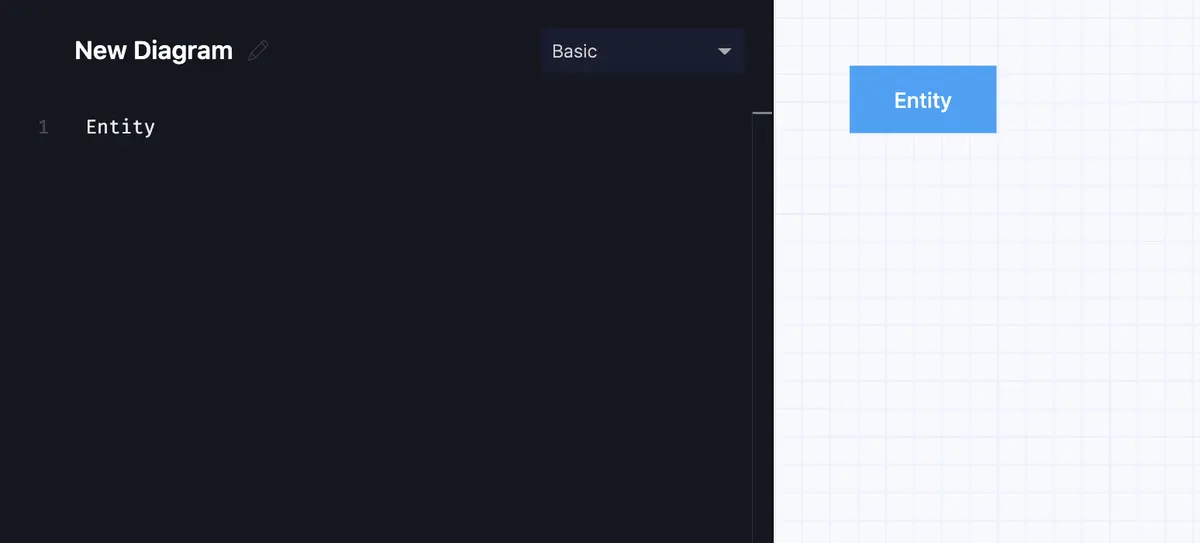
Next up are the real-world external entities that interact with your system. You represent these with rectangles and nouns to describe their role. These entities will exchange data with your system. They might be users, companies, or other systems. You also don’t need to worry about their internals, just that they will be involved.
Once you have your system and the entities that will interact with it, you can start to map out the flow of data. Lines between the entities and your system show the exchange of data. Arrows represent the direction of data flow.
Make your own context diagram with Gleek.
When should you use a context diagram?
A context diagram is most often used when you start work on a new project. As a non-technical design document, it gives business analysts and stakeholders an overview of the scope of the system and lets them voice concerns or give feedback before the project gets underway. They can use it to work out requirements or restrictions, set a budget, and avoid basic design errors in the early stages of the project.
You might also decide to create a context diagram for an existing system if you need to rework or replace the system. The context diagram will ensure that you’ve identified all the external relationships involved.
What are the benefits of a context diagram?
So what are the pros and cons of using context diagrams in your projects?
On the plus side:
You don’t need to be a techie to understand a context diagram. Everyone involved in the project should be able to read it and see what’s happening. All project stakeholders can pitch in and better understand their roles or responsibilities. Unexpected individuals or departments that should be involved might even be revealed by creating the diagram.
Because everyone can understand them, context diagrams open up brainstorming and discussion to the whole team. That can mean useful insights from team members who might otherwise be excluded from the design process.
Those useful insights could highlight missing elements or errors. Finding these mistakes at an early stage will help you avoid costly delays later on.
As the scope of the project emerges, you can identify the necessary interactions and perhaps even scale back some interactions that may not be needed in this version of the project.
Context diagrams are easy to change or extend. If you missed out on some data flow or entity, you can add them without messing with the rest of the diagram.
There aren’t too many negatives when it comes to system context diagrams, but you should be aware of a few concerns:
You can spend a lot of time creating a context diagram, especially when you get the whole team involved in the process.
Despite your best efforts, you may still make mistakes, as the lack of detail in the diagram can conceal essential information.
An overloaded context diagram can eventually become difficult to read at a glance, which defeats its purpose to some extent.
Example: designing a social media platform
Let’s say that we’re designing a new social media platform. We’ll keep it simple so that our system context diagram doesn’t get too complicated.
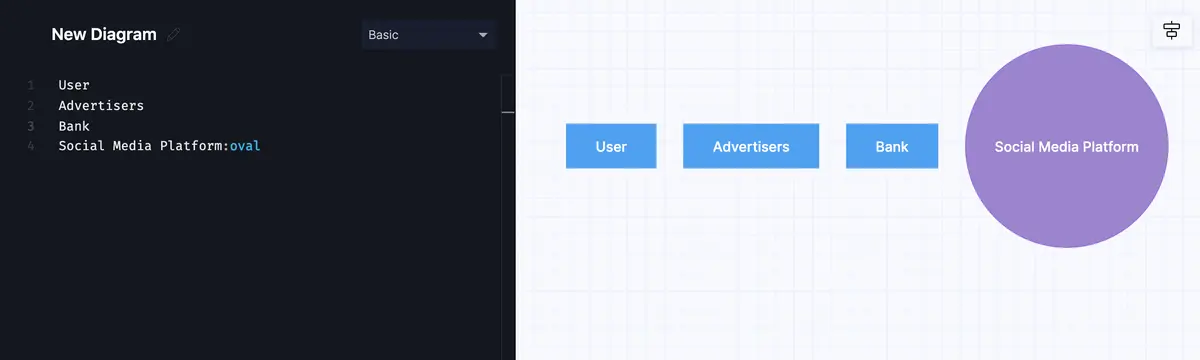
We’ll start by drawing a circle at the center of the empty diagram to represent our product.
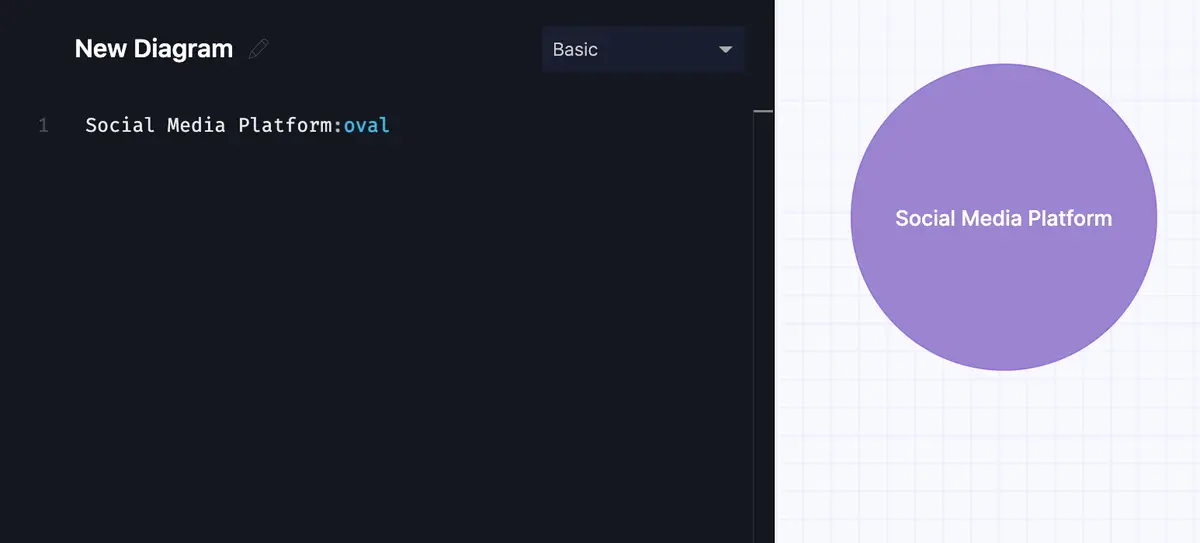
Looks great. Best not to think about all the programming, UX, and UI involved in that single bubble…
Next, we add our first external entity – the user.

As with our product, we aren’t going into too much detail about the user at this point.
We want our new platform to be profitable, but we don’t think our users will pay us (yet) so we’ll need advertising. That means we need another external entity.
Introducing money into the discussion leads to the next external entity – the bank.
We’ll probably identify more external sources of inputs and outputs as we go on, but that will be enough for us to start working out the initial flow of data.
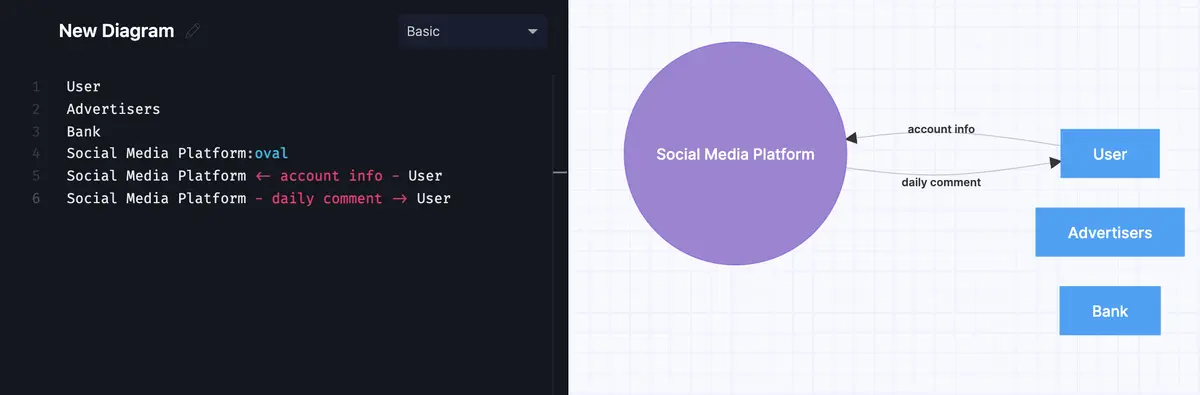
Because we’re keeping it simple, we only want our users to be able to upload a single comment each day about their lives. That gives us the first interaction. But even before that, we need the user to give us some information about themselves, such as username, password, and date of birth. So the user gives us two inputs: account info and daily comment. Our platform will send the user a feed of daily comments from others. That’s the most basic output from us to the user.
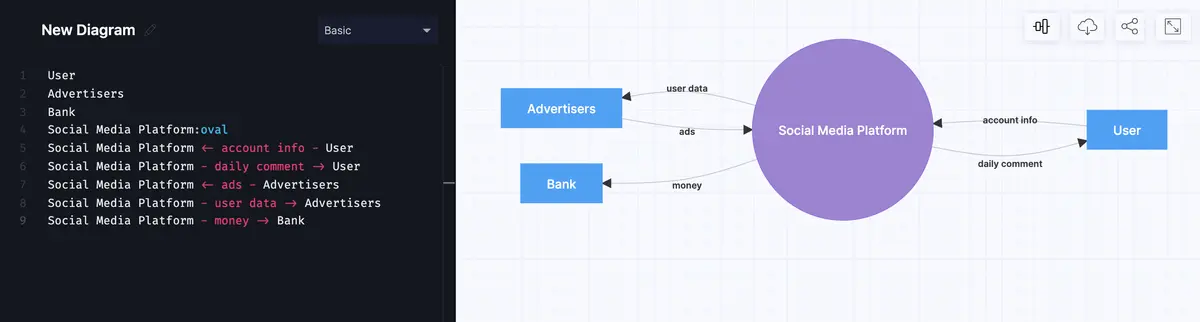
Getting to the other entities, our advertisers will send us ads that we’ll serve to the users mixed in with their feed, and in return, we’ll send some user data to the advertisers for ad targeting. The advertisers will also hopefully send us money, which we’ll send to the bank.
At this point, you can probably start to identify some missing entities and relationships in the structure and flow of our new social media platform. That tells you that the context diagram is doing its job – warning you of potential problems and guiding you in this first step of creating your system.
Make your own context diagram with Gleek.
Use Gleek to make your system context diagram and say goodbye to fiddly drag-and-drop interfaces. Gleek’s keyboard-based diagramming tools are for developers who don’t want to have to even touch a mouse. Just type out your diagram and Gleek will do the rest.