
UML and ERDs are both used by software developers to map out software systems and databases before any actual coding occurs. Making a diagram beforehand helps developers see what components are needed, and how the system or database will be structured.
UML is a series of symbols and shapes that help to visualize how software systems are organized, and ERDs show the relationships of entities within databases. Both are able to be read by anyone with relative ease.
Learn what UML means in business analysis.
What is UML?
UML, short for Unified Modeling Language, is a set of agreed upon notations, shapes, and symbols that tell the reader what components exist within a software system, their attributes, and how they relate to each other. Planning a software system is a crucial step that cannot be skipped, much like how architects and construction workers cannot build a house without a blueprint. Anyone can learn to read and use UML, regardless of whether they’re in the software development field or not.
Make your own UML diagram with Gleek.
There are many types of UML diagrams, all with different functions, yet using very similar symbols. There are two types of UML diagrams: structural and behavioral. Here are a few of the most common UML diagram types.
For more detailed information on UML diagrams, check out our article on UML diagram types.
Common types of UML structural diagrams
Profile diagram – This diagram type extends the UML model using stereotypes, which allows for the creation of certain domains and platforms.
Package diagram – Package diagrams show components as bundles of information, which makes organization more manageable.
Class diagram – The most common UML diagram type, class diagrams show the associations between classes and interfaces.
Related topic: Aggregation vs Composition Explained
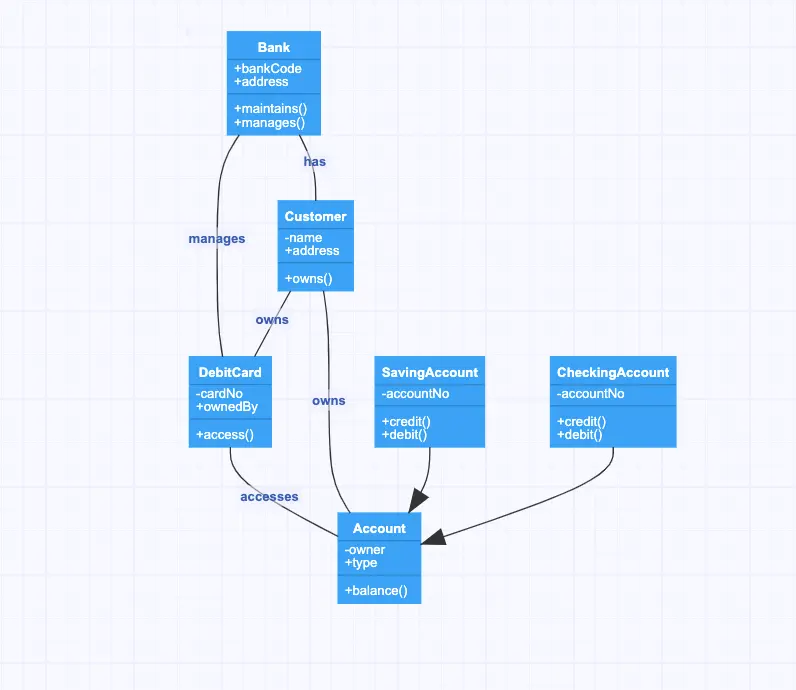
Source: Bank diagram example
Deployment diagram – Deployment diagrams are used to show real world entities, such as servers, and the deployment of nodes within the system.
Object diagram – These diagrams show objects and how they relate and interact with each other.
Common types of UML behavioral diagrams
Sequence diagram – Another of the most common UML diagram types, sequence diagrams show how objects interact, and in what order, over time.
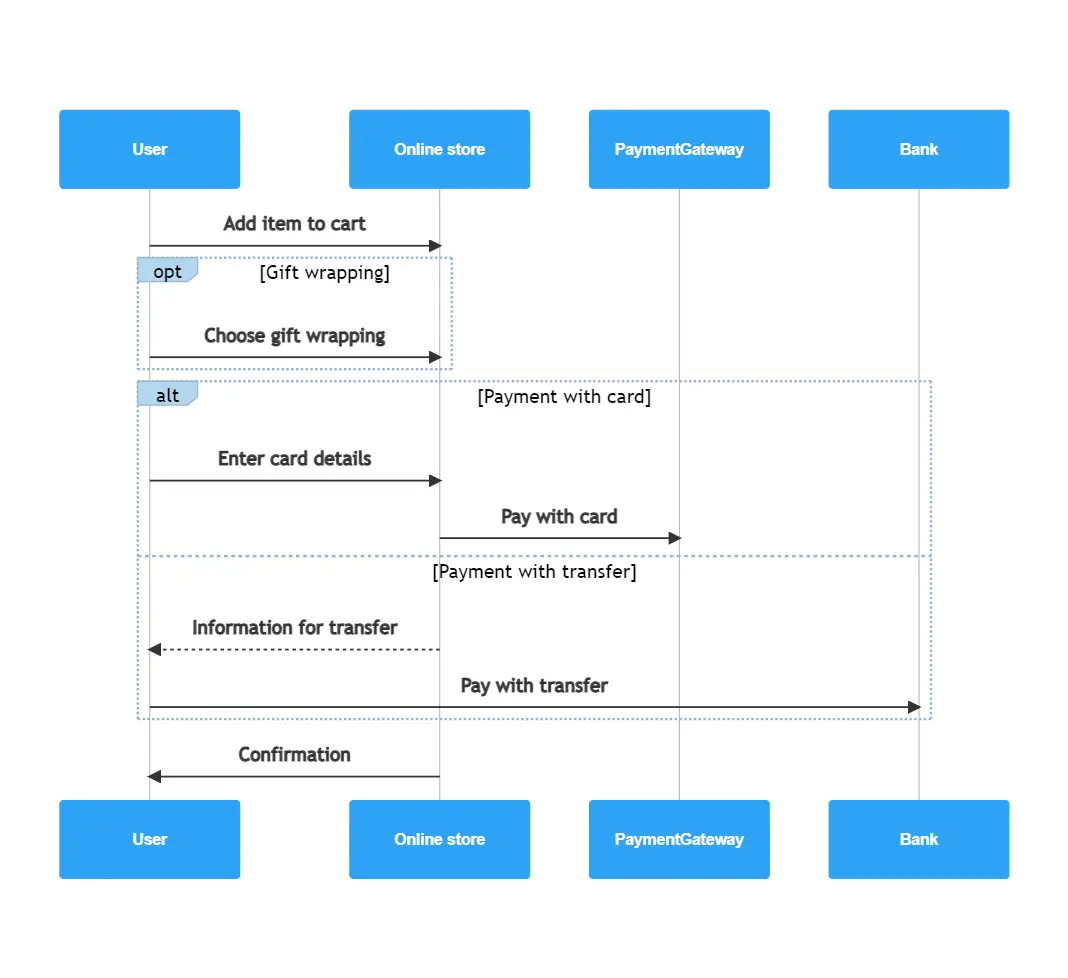
Online shopping system sequence diagram
Interested in making sequence diagrams? Read our article about the top 8 UML sequence diagram tools.
Activity diagram – Similar to sequence diagrams, activity diagrams focus on how control shifts between objects when certain actions are performed.
Use case diagram – With use case diagrams, we can see the user and all the specific actions they can take when interacting with the system. The chart then shows how these actions activate and move through the system.
Communication diagram – Communication diagrams are similar to sequence diagrams, but instead focus on interactions within the whole system, rather than how long they take.
Interaction overview diagram – These are more detailed versions of activity diagrams, and show not only the flow of activities and control, but also allow for other inline actions to be added.
What is an ERD?
ERD is short for Entity Relationship Diagram, and they are used to plan and model databases before their creation. ER diagrams are an offshoot of the entity-relationship model, which shows how entities interact in a database.
Check out what are the best Entity-relationship tools.
ERD notations
There are 6 notation types used to make ERDs that serve different functions for the reader. Here are a few of the most common ones.
Check out our article on entity-relationship diagram notations to learn more about all 6 types.
Chen notation – This notation type is more detailed than others. Users can identify entities and relationships as weak or strong, and attributes can be classified in additional ways.
Crow’s foot notation – Crow’s notation is one of the more detailed notation styles. One difference is the presence of multiplicities, which tell the reader how many instances interact with other instances.

Hospital management system ER diagram with Crow’s foot notation
Barker notation – The most recognized form of ERD notation, this style shows relationship degrees, optionality, and attributes as mandatory or optional.
Common ERD components
Entities – Real world objects, such as users, are represented with rectangles. There are several kinds of entity notations.
Strong entity – Shown in one rectangle. Strong entities stand alone, and often have weaker entities relying on them.
Weak entity – Two rectangles, one slightly smaller than the other. Weak entities rely on another entity.
Make your own ER diagram in Gleek.
Associative entity – A diamond inside a rectangle. Associative entities show the relation of several entity types, as well as attributes specific to each interaction.
Attributes – These are the qualities or characteristics entities have, and are shown in ovals.
Attribute – In a single oval, attributes are qualities entities have in one to one or many to many relationships.
Multivalued attribute – Two ovals, one inside the other. A multivalued attribute is able to take on more than one value.
Derived attribute – Represented by an oval with a dashed or dotted line. These attributes are values that are calculated from other, associated attributes.
Keys – Keys are a way to categorize attributes using lines and symbols, and they connect relevant fields. Keys clearly and concisely show information, which keeps the diagram from becoming too cluttered. There are two types of keys.
Primary keys – One or more attributes that define exactly one instance of an entity
Foreign keys – Created in a one to one or a one to many relationship, when one entity relates to another entity.
Find out what are the differences between Primary and Foreign keys.
Relationships/Cardinality – Represent ed with diamonds, relationships are how entities interact with each other. There are 3 common relationship types.
1:1 (one-to-one) – Entities share exactly 1 instance with each other.
1:M (one-to-many)– One relationship of an entity has multiple relationships with another.
M:N (many-to-many)– Two entities both share many instances with another.
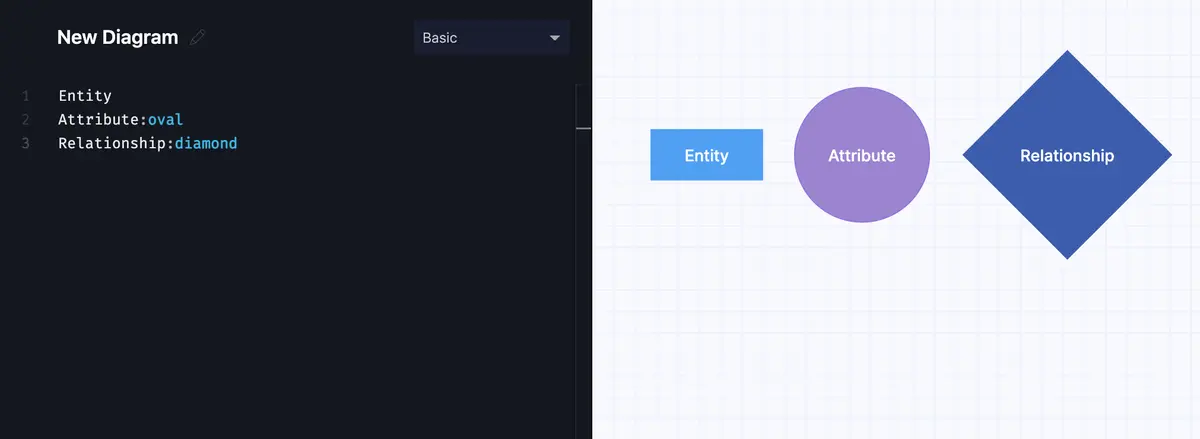
Common ERD components: Entity, Attribute and Relationship.
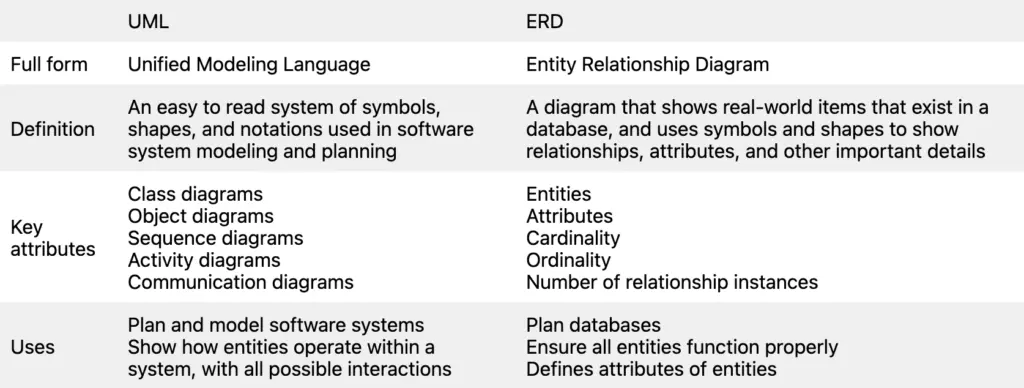
What is the difference between UML and ERD?
The main difference between UML and ER diagrams is that UML is a language used to create diagrams, whereas ERDs are a type of diagram. UML is used for planning software development, and is used in many different diagrams for various purposes. ER diagrams do not focus on the software, but rather the modelling of databases, which are usually part of a software system. UML diagrams are broader, and have many uses, and ERDs only have one purpose. Here are some other notable differences between ER diagrams and UML.
Make your own UML diagram with Gleek.
With Gleek, you can create UML diagrams with just a few keystrokes. Whether you need an ER diagram, or UML types like class or object diagrams, Gleek can help you plan your software systems and databases using simple keyboard commands. Check out Gleek’s template collection, and get started for free.
Related posts
UML relationships explained: Dependency, Realization, Association
Guide to entity-relationship diagram notations & symbols
UML Essentials: Aggregation vs Composition Explained
Best 7 UML tools to use in 2022
How to represent a weak entity in ER diagram