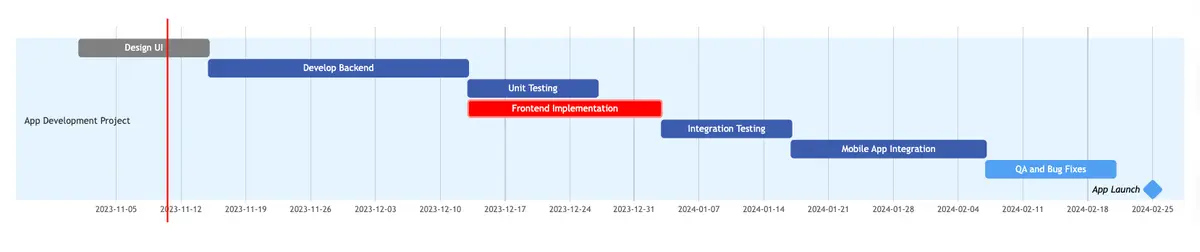
This Gantt chart illustrates the sequential stages of an app development project. It begins with UI design, followed by backend development, unit testing, and critical frontend implementation. Integration testing leads to mobile app integration, followed by QA and bug fixes. The project culminates in the milestone of the app launch on February 25, 2024. Each phase relies on the completion of the preceding task, demonstrating a structured progression toward the final launch of the application.
Edit this diagram in Gleek
App development project diagram code in Gleek
/g App Development Project
Design UI
Done
2023-11-01
2w
Develop Backend
Active
=> Design UI
4w
Unit Testing
Active
=> Develop Backend
2w
Frontend Implementation
Crit
=> Develop Backend
3w
Integration Testing
Active
=> Frontend Implementation
2w
Mobile App Integration
=> Integration Testing
Active
3w
QA and Bug Fixes
=> Mobile App Integration
2w
App Launch
Milestone
2024-02-25
About Gantt charts
Gantt charts, named after Henry Gantt, aid in project organization and monitoring, showcasing task timelines, durations, and overlaps. They're versatile tools used across industries, offering an overview of project lifecycles, beneficial for planning, resource allocation, and stakeholder communication. These charts assist in scheduling, dependency identification, and progress visualization, enhancing task management and resource allocation for effective project execution.
Similar gantt chart examples
Supply chain management gantt chart
Construction Project Management gantt chart
School management system project gantt chart
Website development gantt chart
Implementation plan gantt chart
Research project proposal gantt chart