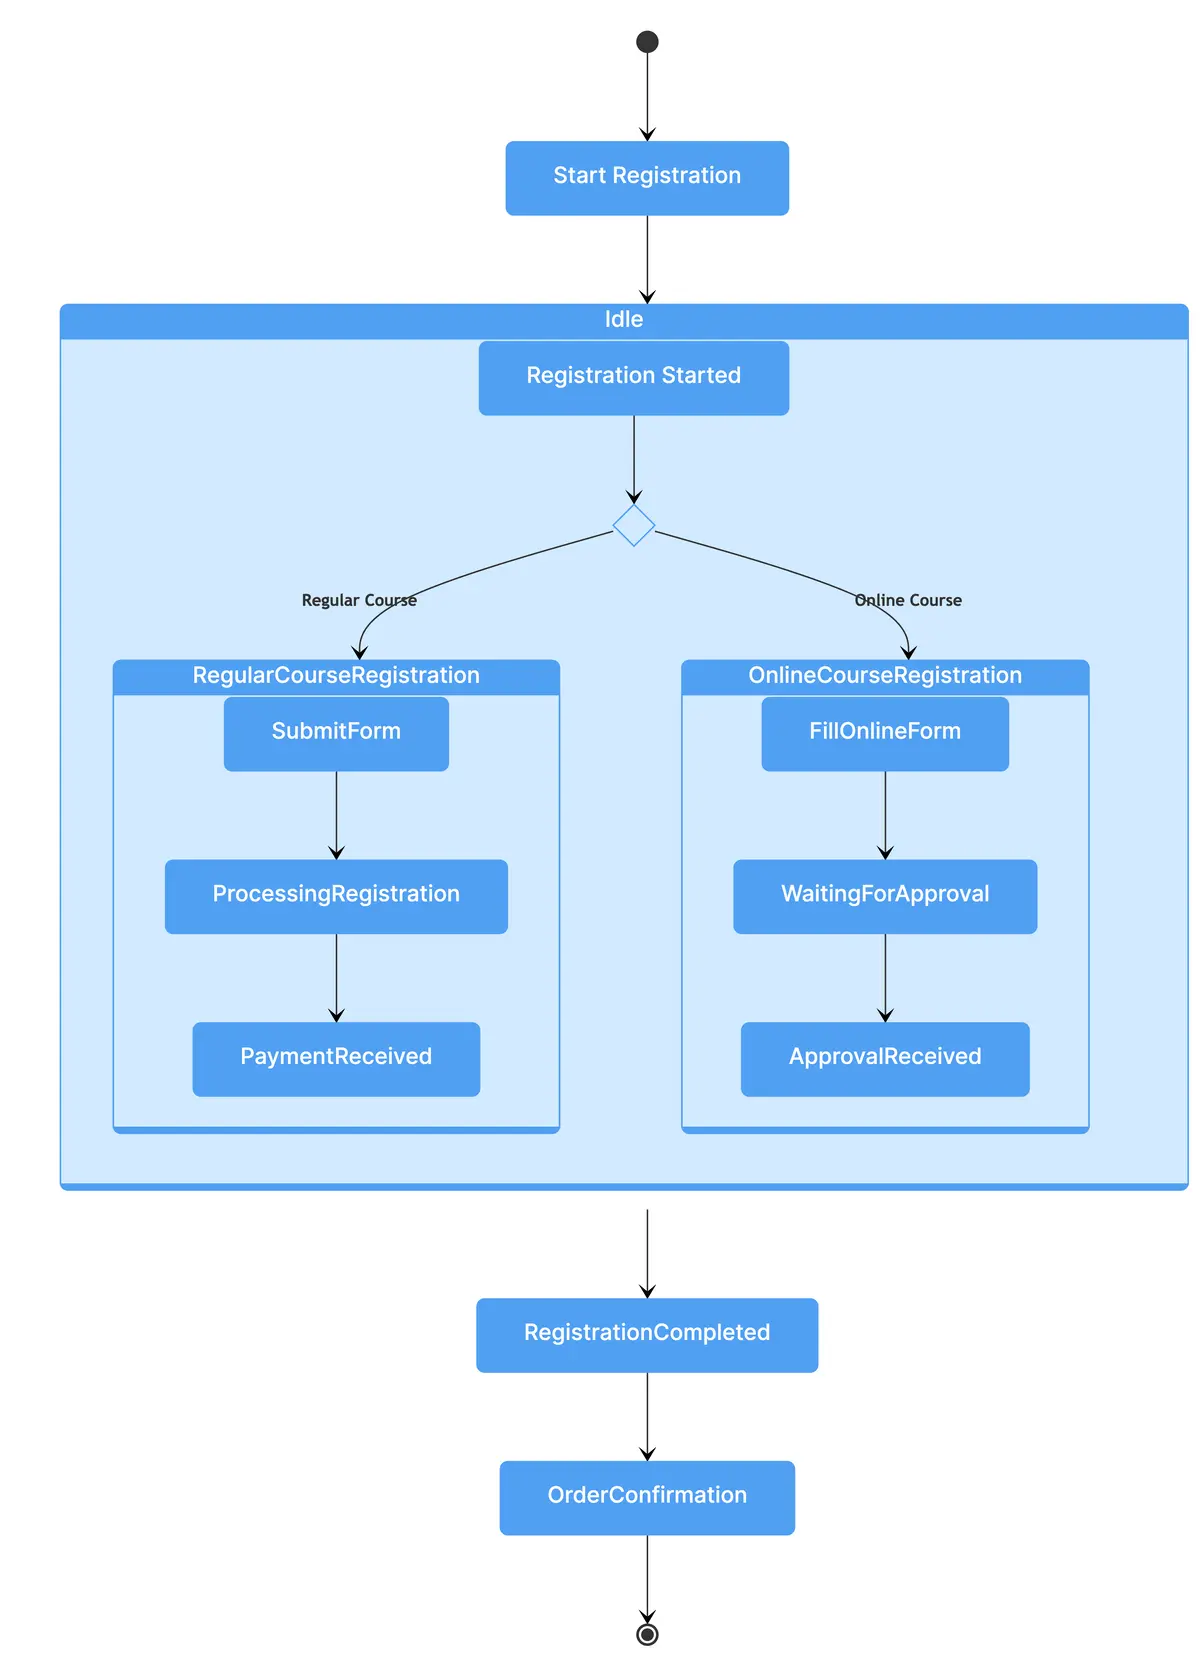
This state diagram outlines a student registration process, starting at 'Start Registration' and branching into 'Regular Course Registration' or 'Online Course Registration' based on user choice. For 'Regular Course Registration', it progresses from submitting the form to payment verification, while 'Online Course Registration' involves filling out an online form and awaiting approval. Both paths culminate in 'RegistrationCompleted', leading to 'OrderConfirmation' before looping back to the initial state, symbolizing the completion of the registration process.
Edit this diagram in Gleek
Student registration process diagram code in Gleek
[O]-->Start Registration-->Idle
/g Idle
Registration Started--> RegistrationType:choice
RegistrationType-Regular Course->RegularCourseRegistration
RegistrationType-Online Course->OnlineCourseRegistration
/g RegularCourseRegistration
SubmitForm-->ProcessingRegistration
ProcessingRegistration-->PaymentReceived
/else
/g OnlineCourseRegistration
FillOnlineForm-->WaitingForApproval
WaitingForApproval-->ApprovalReceived
Idle-->RegistrationCompleted
RegistrationCompleted-->OrderConfirmation-->[O]
About state diagrams
State diagrams, a subset of UML's behavioral diagrams, visualize object lifecycles and transitions, pivotal in computer science. These diagrams portray system states, transitions, and event triggers, aiding software, circuits, and protocol designs. In modeling reactive systems, they clarify responses to internal or external events, bridging understanding across technical and non-technical stakeholders. State diagrams are indispensable tools, enabling comprehension and illustration of intricate system behaviors.
Similar state diagram examples
Railway reservation system state diagram
Hotel management system state diagram
Library management system state diagram