Flowcharts are essential visual tools for simplifying complex problem-solving across various disciplines. They depict each step of a process using shapes and arrows, transforming intricate issues into clear and manageable sequences. This visual breakdown helps teams identify inefficiencies and improve communication, enhancing collaborative efforts.
Used widely in programming, flowcharts help visualize algorithms and troubleshoot code. In business, they simplify processes like customer service and supply chains, ensuring efficiency. Even in daily life, flowcharts clarify decision-making by mapping options and outcomes. By providing a clear process roadmap, flowcharts help users to analyze and refine tasks, making them invaluable in both professional and personal settings.
Common Scenarios Where Flowcharts Shine
Here’s an expanded look at where flowcharts shine and how they can be applied effectively:
Troubleshooting Technical Issues
Flowcharts are especially beneficial in technical troubleshooting, where they guide users through systematic diagnostics. By visually mapping out each potential issue and corresponding solution, flowcharts help ensure all possibilities are considered. This approach not only aids in quick identification of the root cause but also in training technical staff, providing a clear, repeatable method for addressing common problems.
Make your own flowchart with Gleek.
Mapping Decision Trees
In decision-making, flowcharts act as strategic guides. They allow users to evaluate different options by clearly outlining potential paths and their outcomes. For instance, when choosing a new business strategy, a flowchart can help visualize the impact of various decisions based on factors like budget constraints, target markets, and long-term goals. This visual clarity aids stakeholders in making informed decisions, reducing uncertainty and aligning team objectives.
Planning Workflows
Within project management and business operations, flowcharts bring order to complex processes. By detailing each phase, task, and decision point, they help identify inefficiencies and streamline activities. This not only enhances productivity but also facilitates communication among team members, as everyone can clearly see their role within the larger context.
You might be interested in: Product development flowchart example.
Process Optimization in Manufacturing
Flowcharts are instrumental in optimizing manufacturing processes. They map out each step in a production line, allowing managers to pinpoint bottlenecks and areas for improvement. By visualizing the workflow, teams can experiment with different configurations, track changes, and measure outcomes more effectively, ultimately leading to increased efficiency and reduced costs.
Educational Tools for Teaching Complex Concepts
In education, flowcharts simplify the teaching of complex subjects. They break down intricate theories or procedures into manageable, visual steps, making them easier for students to grasp. Whether it's explaining a scientific process or the stages of historical events, flowcharts enhance comprehension and retention by engaging visual learning styles.
Strategic Planning in Business
For high-level business strategy, flowcharts provide a clear overview of potential plans and their consequences. They help leaders visualize strategic paths and assess risks, facilitating more effective planning sessions. This visual format encourages collaboration, allowing diverse teams to contribute ideas and align on common goals.
Adaptability in Problem-Solving Contexts
The adaptability of flowcharts is one of their greatest strengths. They transition seamlessly between structured environments, like algorithm design, and unstructured situations, such as brainstorming sessions. By providing a visual framework, flowcharts enhance clarity, foster collaboration, and boost efficiency, making them indispensable tools in both professional and personal problem-solving endeavors.
Embracing flowcharts in various scenarios not only assists in solving immediate problems but also cultivates a culture of systematic thinking and continuous improvement. Whether in technical fields or creative settings, the ability to visualize processes is invaluable, underscoring the enduring relevance of flowcharts in problem-solving.
Check out our post on 20 editable flowchart templates.
Step-by-Step Problem-Solving Examples Using Flowcharts
Flowcharts serve as a powerful tool in problem-solving across various domains, and Gleek is an excellent platform to bring these visual strategies to life. Let's explore three practical examples demonstrating how flowcharts can simplify complex processes.
Example 1: A Programming Algorithm – Finding the Largest Number in an Array
This flowchart represents a simple algorithm to find the largest number in an array. The process starts by initializing a variable to hold the largest number, iterating through the array, and updating the variable if a larger number is found. This structured approach is helpful for understanding the logic and debugging code.
Detailed Process Description:
Start: Represented by an oval, this marks the beginning of the algorithm.
Initialization: Use a rectangle to initialize the largest number as the first element of the array.
Iteration: A diamond shape will check if there are more elements in the array to compare.
Comparison and Update: Another rectangle for comparing the current array element with the largest number and updating the value if necessary.
End: Use an oval to signify the completion of the algorithm.
Learn more about Flowchart symbols with examples.
Tutorial in Gleek:
Log in to the Gleek app and click "New Diagram" to start.

Select "Basic" from the dropdown menu.

Use Gleek's syntax to add an oval for "Start." by typing ":queue".

Add a rectangle labeled "Initialize largest = array[0]." Connect "Start" to it with "-->"

Type "More elements in array?" and then add ":diamond" and connect the rectangle to it.

Then connect the diamond to two paths: one for "Yes" (continue iterating) and another for "No" (end).

Make your own flowchart with Gleek.
Use a rectangle for "Compare and update largest" as a continuation of "Continue iterating".

Connect all shapes logically with arrows to complete the diagram.
Example 2: A Decision-Making Flowchart - Choosing the Right Marketing Strategy
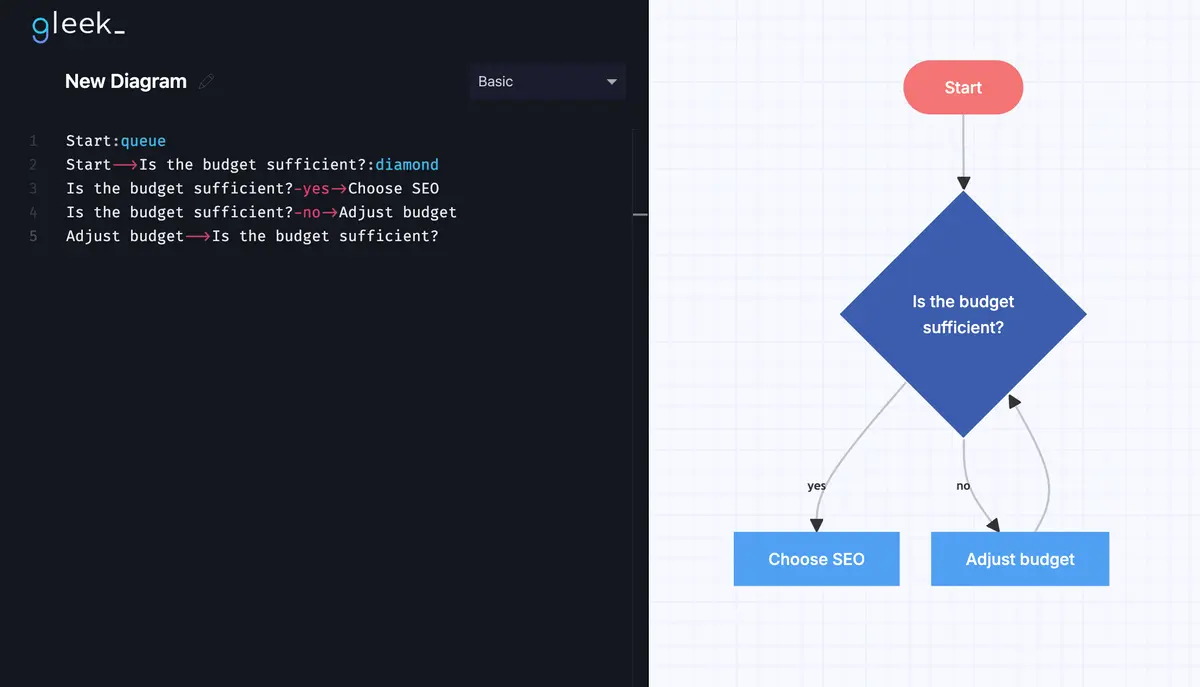
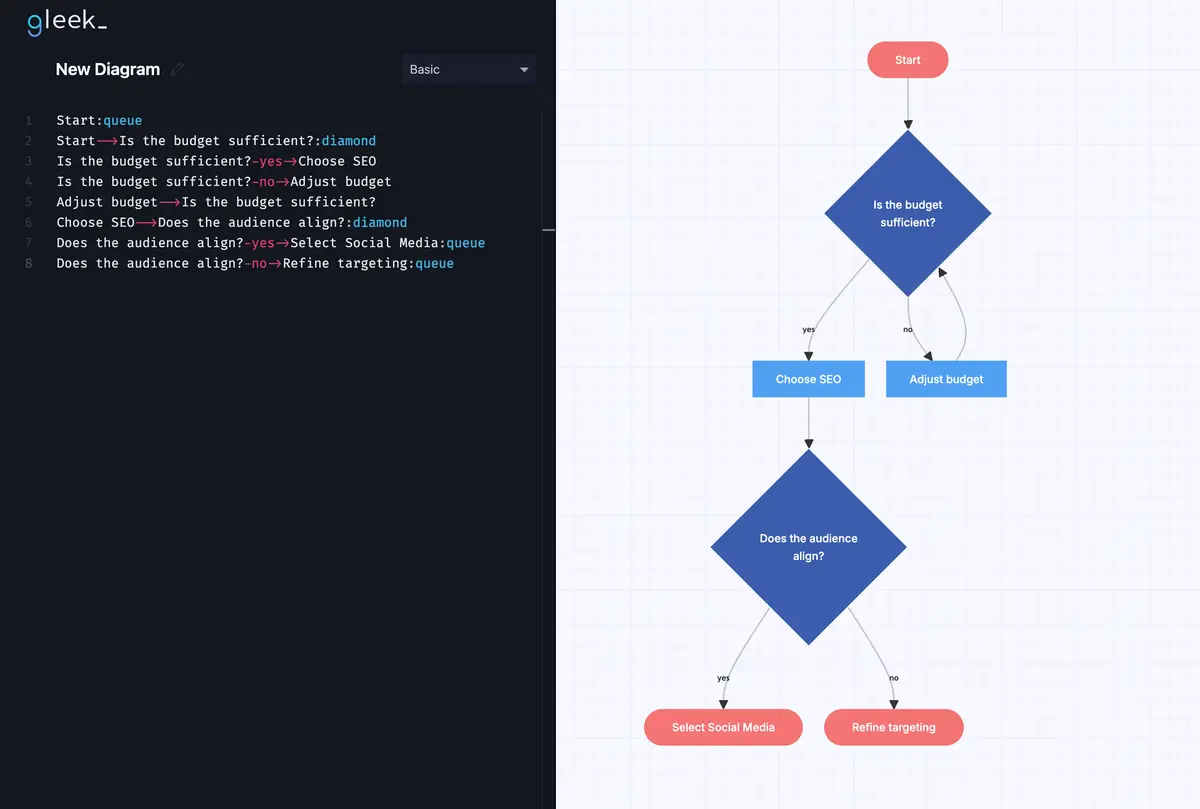
This example focuses on making strategic marketing decisions. The flowchart will evaluate different conditions, such as budget, target audience, and campaign goals, to help determine the best course of action.
Detailed Process Description:
Start: Use an oval to indicate the beginning of the decision-making process.
Budget Check: A diamond shape will assess whether the budget is sufficient for specific strategies.
Audience Targeting: Another diamond evaluates if the target audience aligns with certain campaigns.
Strategy Selection: Rectangles for actions like "Choose SEO," "Select Social Media," or "Run Paid Ads."
End: An oval signifies the completion of the decision-making process.
Tutorial in Gleek:
Log in to Gleek and create a new diagram under "Basic."
Begin by typing "Start." Then, give it an oval shape by typing ":queue"

Add "Is the budget sufficient?" followed with a ":diamond".

Create paths leading to actions (rectangles) such as "Choose SEO" or "Adjust budget." Connect "Adjust budget" back to "Is the budget sufficient?".

Add a second diamond labeled "Does the audience align?" with outcomes like "Yes" within an arrow and connected to "Select Social Media" or "No" within an arrow connected to "Refine targeting." Both outcomes should be oval-shaped.

Connect the shapes to outline the full decision-making flow.
Example 3: A Troubleshooting Flowchart - Fixing a Printer Issue
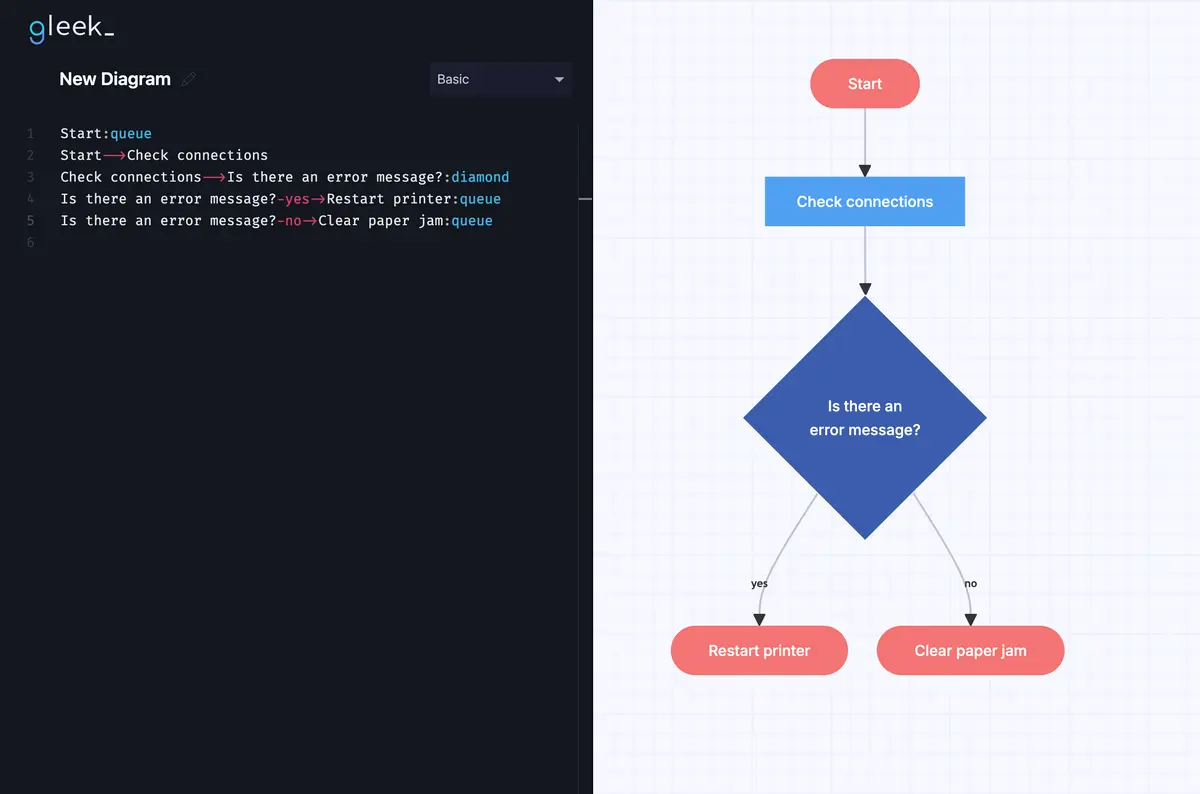
A troubleshooting flowchart guides users through resolving common printer problems, such as connectivity issues or paper jams. This ensures users can systematically identify and address the root cause.
Detailed Process Description:
Start: An oval marks the beginning of the troubleshooting process.
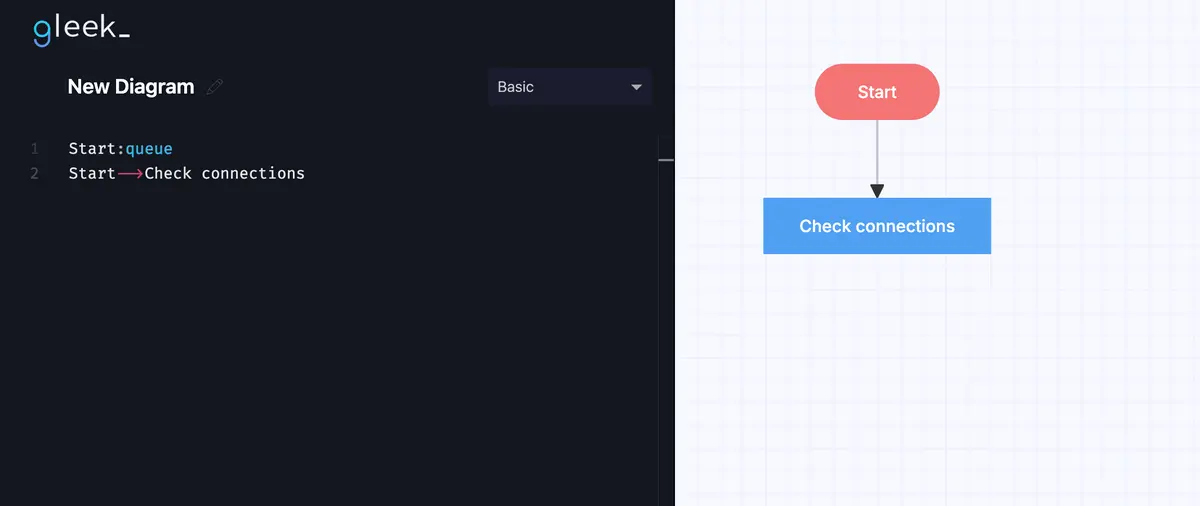
Check Connections: A rectangle represents the step to verify power and cable connections.
Error Check: A diamond shape asks, "Is there an error message?"
Resolve Issue: Rectangles guide users through specific steps, such as "Restart printer" or "Clear paper jam."
End: An oval represents the completion of the troubleshooting process.
Tutorial in Gleek:
Log in to Gleek and start a new diagram.
Add an oval labeled "Start."
Insert a rectangle labeled "Check connections."

Use a diamond for "Is there an error message?"

Make your own flowchart with Gleek.
Add paths, first is "yes" within an arrow, leading to steps like "Restart printer" or "No" within an arrow leading to "Clear paper jam," represented by rectangles.

Use arrows to connect all elements and ensure logical flow.
Save and share the flowchart, making updates as needed when troubleshooting steps evolve.
Gleek's intuitive interface and features make the flowchart creation process more seamless, allowing users to quickly iterate and adapt their strategies for effective problem-solving. By utilizing flowcharts in various scenarios, users can enhance clarity, improve decision-making, and facilitate efficient troubleshooting, making them indispensable tools in both professional and personal settings.
Related topic: Visual problem solving with flowcharts and mind maps
Mastering Flowchart Problem Solving
Gleek makes the creation and utilization of flowcharts more accessible than ever. Its intuitive interface allows users of all skill levels to dive right in without a steep learning curve.
And whether you're solving a technical issue, planning a strategic initiative, or optimizing a workflow, the use of flowcharts can lead to more professional and efficient results. By integrating flowcharts into your problem-solving toolkit, you not only enhance your ability to address current challenges but also develop a valuable skill set that will serve you well in future endeavors.
So why wait? Start experimenting with creating your flowcharts today using Gleek and unlock the potential of visual problem-solving. Embrace this approach to gain a competitive edge, drive innovation, and achieve your goals with greater effectiveness and confidence.
Related posts
20 editable flowchart templates & examples
Uses for cross-functional flowcharts
Process Maps vs. Flowcharts: An in-depth analysis
7 stages of the product development process (flowchart example)
What are flowchart symbols? Here’s a handy guide with examples
